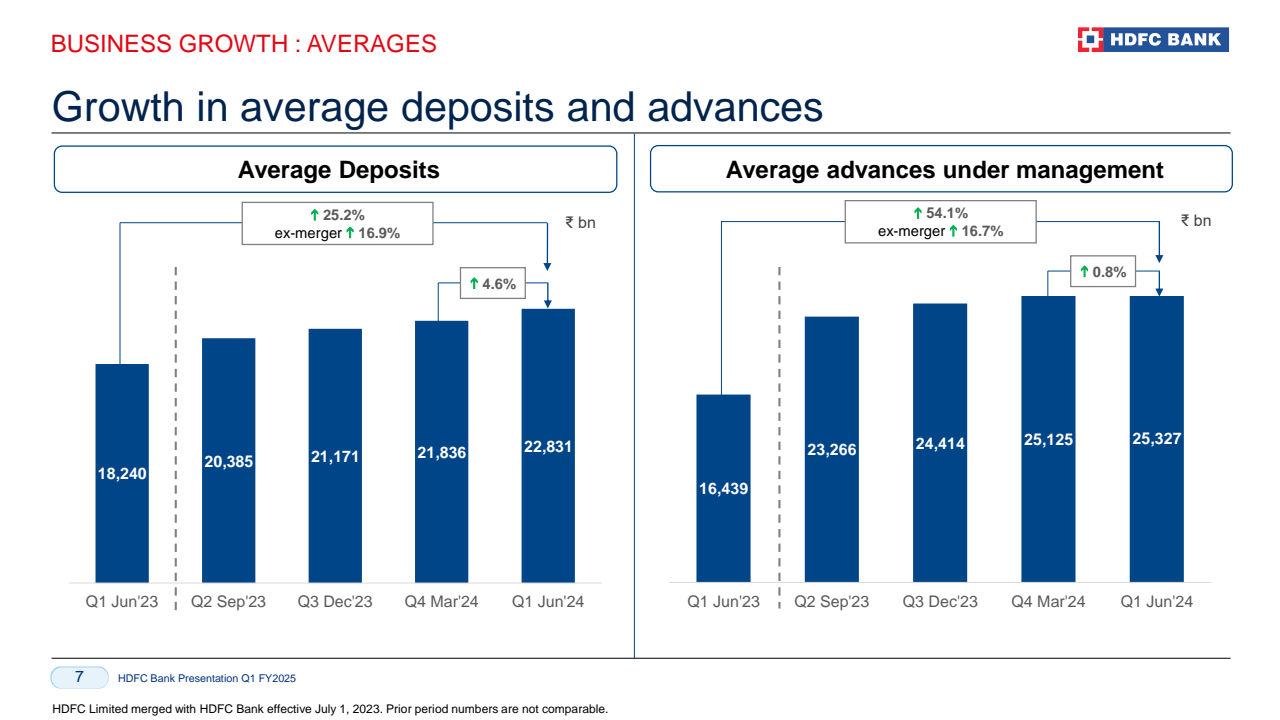
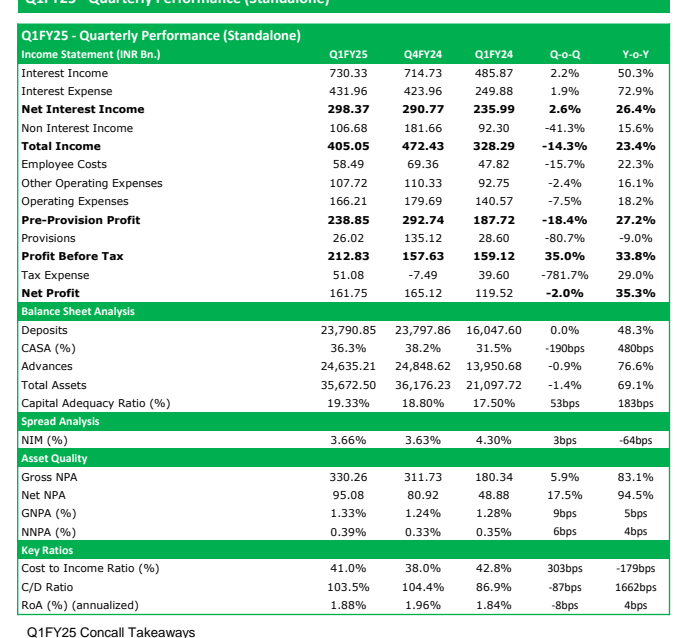
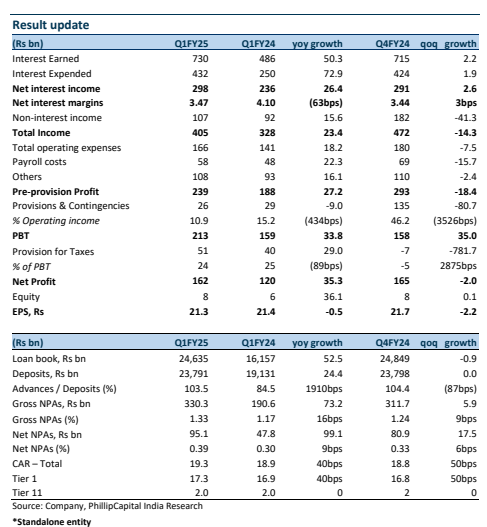
HDFC Bank's Q1 FY25 performance demonstrates a stable financial standing with a strategic focus on long-term profitability and resilience. The bank faced a slight net attrition in deposits due to unexpected outflows in current accounts and a rundown of ₹160 billion in erstwhile HDFC non-retail deposits. Despite this, the bank has started disclosing average deposits to present a more stable and long-term view, showing a steady upward trend from Q1 FY22 to Q1 FY25.
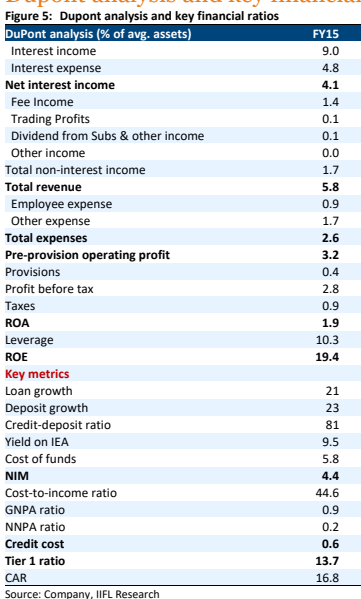
Key financial metrics indicate stability and growth. Net Interest Margins (NIMs) remained stable between 3.4% and 3.5%, with an increasing bias. The CASA ratio was maintained between 36% and 38%, and the cost-to-income ratio was between 40% and 41% with a decreasing bias. Gross Non-Performing Assets (GNPA) showed a declining trend, excluding agricultural seasonality, falling between 1.2% and 1.4%. Return on Assets (ROAs) were in the region of 1.9% to 2.1%. The bank also added 2.2 million new customer relationships during the quarter, and its market share growth has been around 50 to 60 basis points annually, with a current market share slightly above 8% as of March 2020.
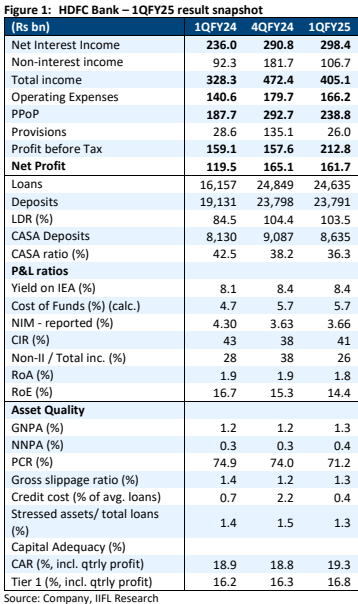
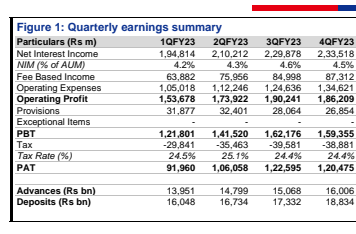
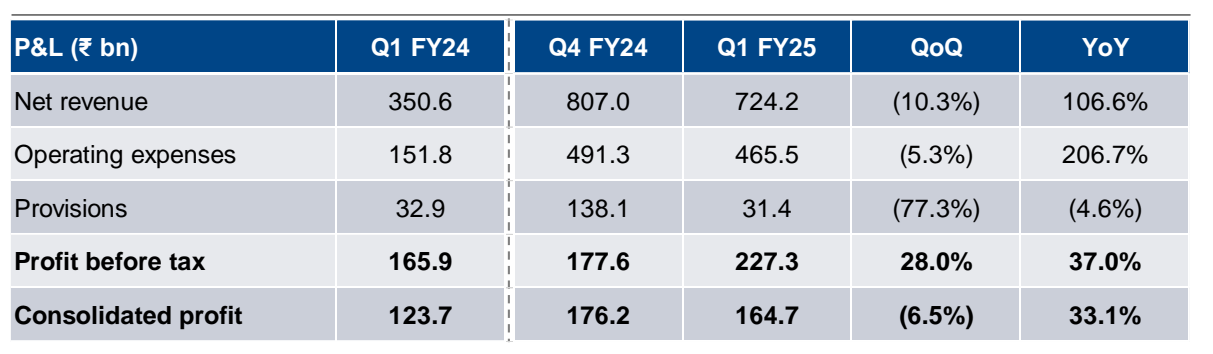
The bank made significant strides in reducing borrowings, with a reduction of ₹75,000 crores in the March quarter and about ₹60,000 crores in the June quarter. Non-interest income saw a sharp increase due to credit recoveries and dividends from subsidiaries, while fee income growth was driven by third-party products.
Looking ahead, HDFC Bank aims to prioritize profitability over growth, focusing on reducing the loan-deposit ratio by growing advances slower than deposits. Strategic investments in distribution and technology will continue, ensuring stability in key metrics and resilience in operations. The bank plans to enhance customer engagement and service delivery to increase CASA ratios, with new customer acquisitions expected to bring in higher savings account balances. A conservative approach to unsecured personal loans aligns with regulatory guidance and internal risk assessments. Margin management remains disciplined, focusing on customer engagement and service delivery over rate competition.
| Metric | Value | Management Commentary |
|---|---|---|
| Net Interest Margin (NIM) |
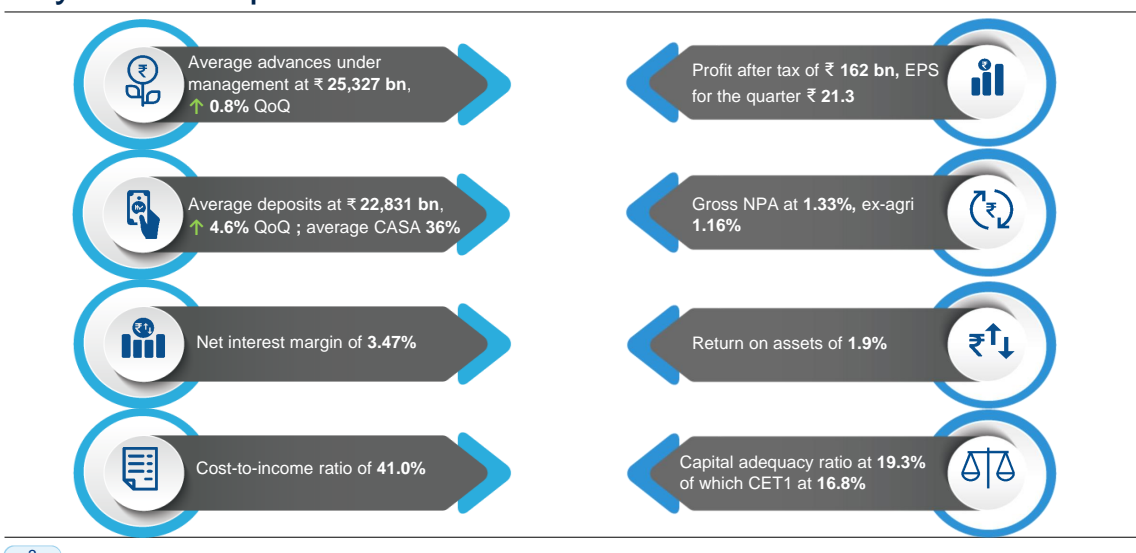
3.47%
1
2
3
|
Management emphasized stability and resilience post-merger, maintaining NIM in the range of 3.4% to 3.5%, indicating effective interest rate spread management. |
| Return on Average Assets (ROAA) / Return on Average Equity (ROAE) |
ROAA: 1.9%, ROAE: 15.0%
1
2
3
|
ROAA has been stable between 1.9% to 2.1%, reflecting operational efficiency. ROAE stability inferred from overall financial performance commentary. |
| Cost-to-Income Ratio |
41.0%
1
2
3
|
Maintained in the range of 40% to 41% with efforts to improve efficiency through strategic investments in distribution and technology. |
| Gross/Net Non-Performing Assets (NPA) Ratio |
Gross NPA: 1.33%, Net NPA: 0.4%
1
2
3
|
Gross NPA ratio stable between 1.2% to 1.4%, reflecting effective asset quality management; Net NPA at 0.4% indicates low level of non-performing assets. |
| Deposit Growth |
4.6% (QoQ)
1
2
3
|
Average deposits grew by 4.6% QoQ; CASA ratio decreased to 36% from 38%. Management focused on profitable growth and mitigating seasonal fluctuations and merger impacts. |
| Advances Growth |
0.8% (QoQ)
1
|
Average advances under management grew by 0.8% QoQ. Management adopted a cautious approach to prioritize profitable growth over sheer volume growth. |
| Net Profit (Standalone/Consolidated) |
Standalone: ₹161.7 billion, Consolidated: ₹164.7 billion
1
2
3
|
Despite slight QoQ decrease, significant YoY increase; Management highlighted stability in key metrics contributing to robust financial performance. |
| Capital Adequacy Ratio (CAR) |
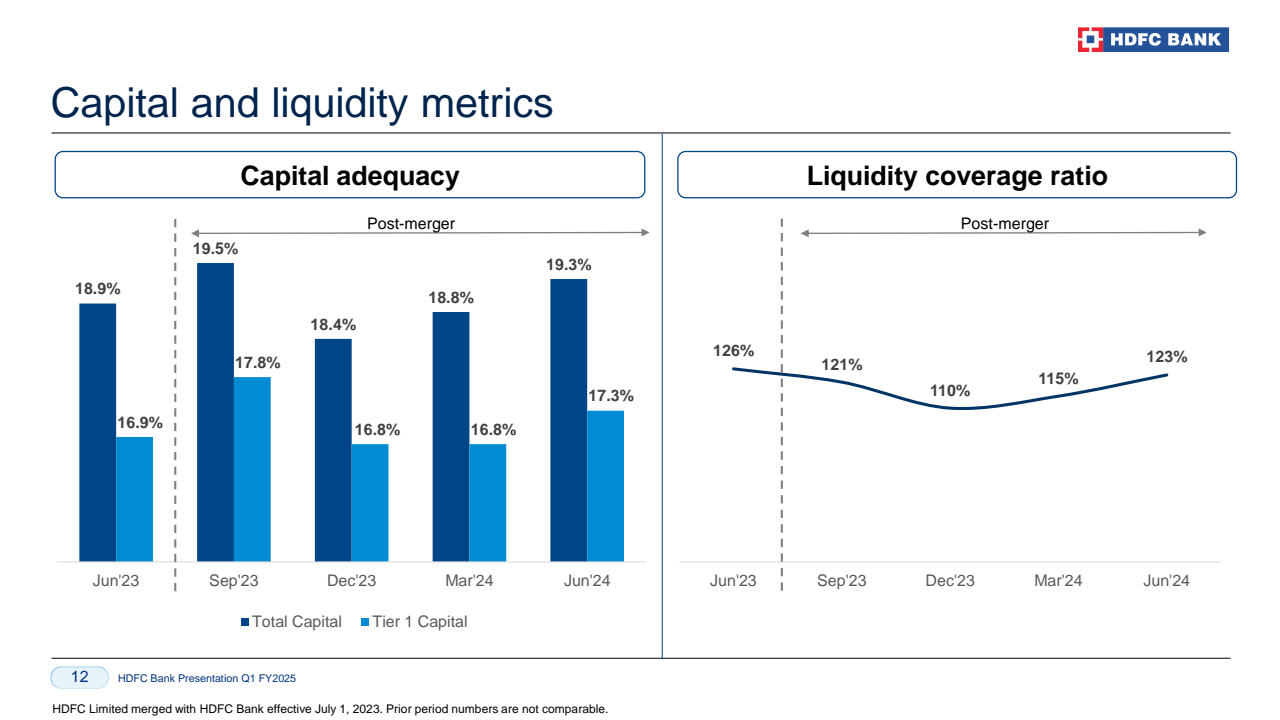
19.3%
1
2
3
|
Reflects strong capital position with CET1 at 16.8%. Management commentary focused on overall financial stability and resilience post-merger. |
| Broker | Target Price (₹) | Rating | Perspective |
|---|---|---|---|
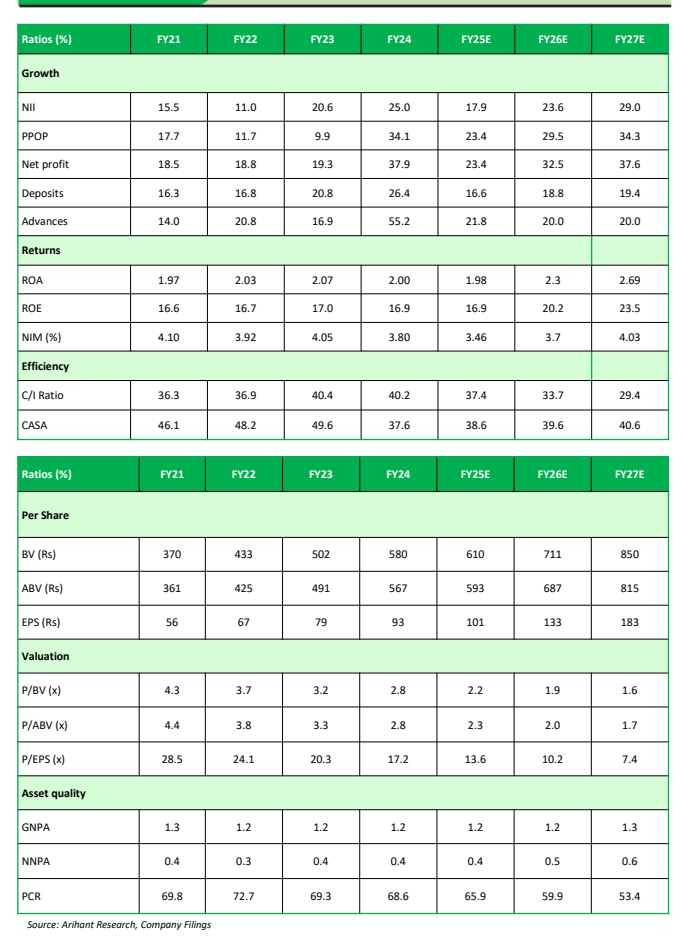
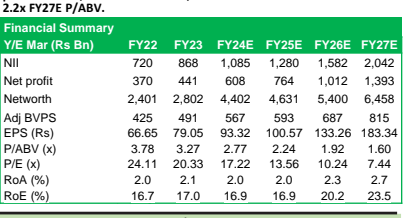
| Arihant Capital | 2,017 | Buy | Valuation based on Sum-of-the-Parts (SOTP), standalone bank valued at 2.2x FY27E P/ABV |
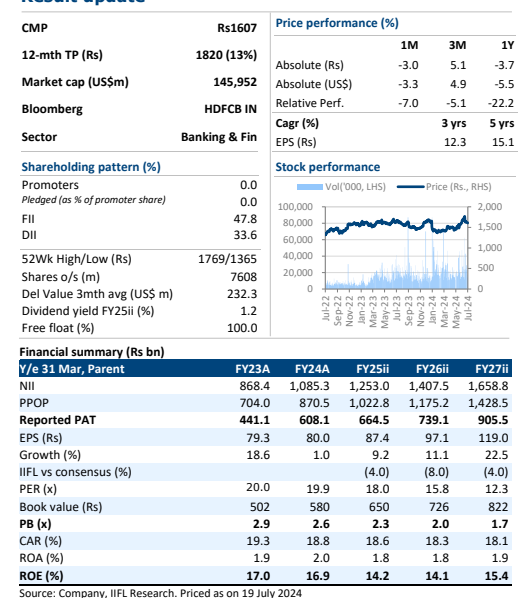
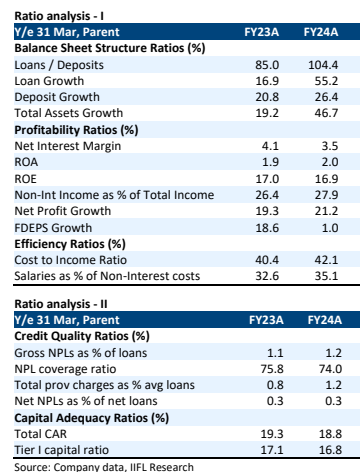
| IIFL | 1,820 | Buy | Bank trading at 2.0x core FY26E P/B, at a 19% discount to ICICI Bank |
| Incred | 2,000 | Add | Stable margins, improved operating leverage, low provision costs |
| Philip Capital | 1,800 | Buy | Earnings growth of 7% in FY25E and 15% in FY26E, ROA of 1.8% for both years, core book trades at 2.2x/2x FY25E/26E ABVPS, subsidiary valued at ₹196 per share |
| Risk Category | Key Risks | Report Sources |
|---|---|---|
| Deposit Growth and Liquidity |
- Shortfalls in Deposit Growth
- Deposit Accretion Issues - High-Cost Deposit Repayments |
- Earnings Call Transcript - IIFL Report - Incred Report |
| Loan-Deposit Ratio (LDR) and Loan Growth |
- High LDR - Slowdown in Loan Growth |
- Earnings Call Transcript - Arihant Report - IIFL Report - Incred Report |
| Asset Quality and Credit Risk |
- Deterioration in Asset Quality
- Sector-Specific Risks |
- Arihant Report - IIFL Report - Philip Capital Report |
| Competitive Pressure and Market Conditions |
- Increased Competitive Intensity
- Competitive Pricing in Corporate Loans |
- Earnings Call Transcript - Incred Report |
| Regulatory and Operational Challenges |
- Regulatory Scrutiny and Approvals
- Operational Expenses |
- Arihant Report - Incred Report - Philip Capital Report |
| Economic and Financial Market Impact |
- Economic Downturns - Interest Margin Pressures |
- Incred Report - Philip Capital Report |
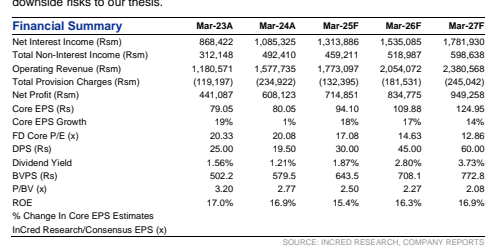
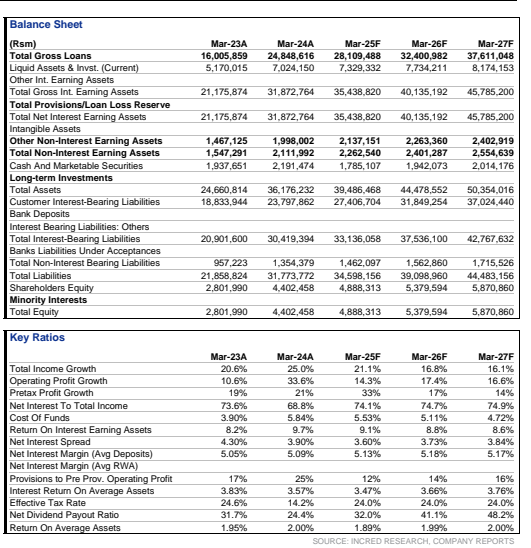
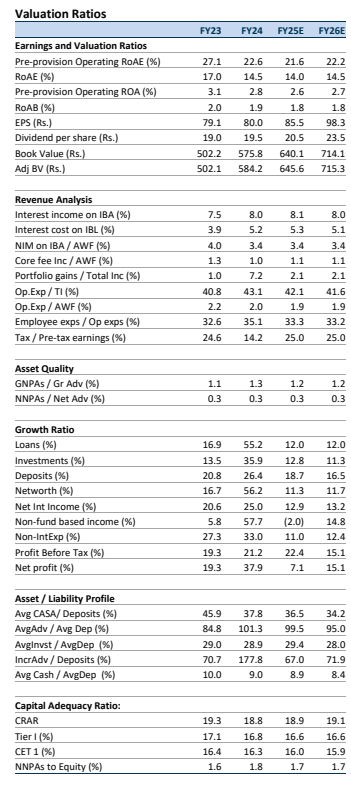
All brokers forecast significant increases in NII, suggesting robust growth in core banking operations. Arihant Capital is particularly bullish, expecting NII to nearly double by FY27E, reflecting optimism about the bank's ability to manage interest-earning assets effectively.
Brokers differ in their views on profitability metrics such as Return on Equity (RoE) and Net Profit. Arihant Capital predicts a steep rise in net profit and RoE, peaking at 23.5%, whereas Philip Capital forecasts a more moderate increase, maintaining RoE at around 14%. This indicates different expectations of the bank’s operational efficiency and risk management.
The P/E and P/BV ratios indicate varying market expectations. Arihant’s projections suggest a significant re-rating of the stock as earnings increase, with P/E dropping sharply. In contrast, Philip Capital's estimates show a gentler decline, indicating a more conservative view of earnings growth or market valuation.
| Metric | Arihant Capital (FY24E-FY27E) | IIFL Security (FY23A-FY27ii) | InCred (FY25F-FY27F) | Philip Capital (FY25E-FY26E) |
|---|---|---|---|---|
| Net Interest Income (NII) | ₹1,085B to ₹2,042B | ₹868.4B to ₹1,658.8B | ₹1,313.9B to ₹1,781.9B | ₹1,225B to ₹1,387B |
| Net Profit | ₹608B to ₹1,393B | ₹441.1B to ₹905.5B | ₹714.9B to ₹949.3B | ₹651B to ₹749B |
| Earnings Per Share (EPS) | ₹93.32 to ₹183.34 | ₹79.3 to ₹119.0 | ₹94.10 to ₹124.95 | ₹86 to ₹98 |
| P/E Ratio | 17.22x to 7.44x | 20.0x to 12.3x | 17.08x to 12.86x | 18.8 to 16.3 |
| P/BV Ratio | 2.77x to 1.60x | 2.9x to 1.7x | 2.50x to 2.08x | 2.2 to 2.0 |
| Loan Growth | N/A | 12% CAGR (FY25-27E) | N/A | 12.0% annually |
| Deposit Growth | 16.6% to 19.4% | 16% CAGR (FY25-27E) | N/A | 18.7% to 16.5% |
| Return on Assets (RoA) | 2.0% to 2.7% | 1.9% to 2.0% | ~2% annually | 1.8% annually |
| Return on Equity (RoE) | 16.9% to 23.5% | 14.2% to 15.4% | 15.4% to 16.9% | 14% annually |
| Net Profit Growth | 23.4% to 37.9% | N/A | N/A | N/A |
| Total Assets | N/A | N/A | ₹39,486.5B to ₹50,354B | ₹40,539B to ₹45,277B |
| Gross NPA (GNPA) | 1.2% to 1.3% | 1.3% to 1.4% (FY25ii-FY27ii) | N/A | 1.2% annually |